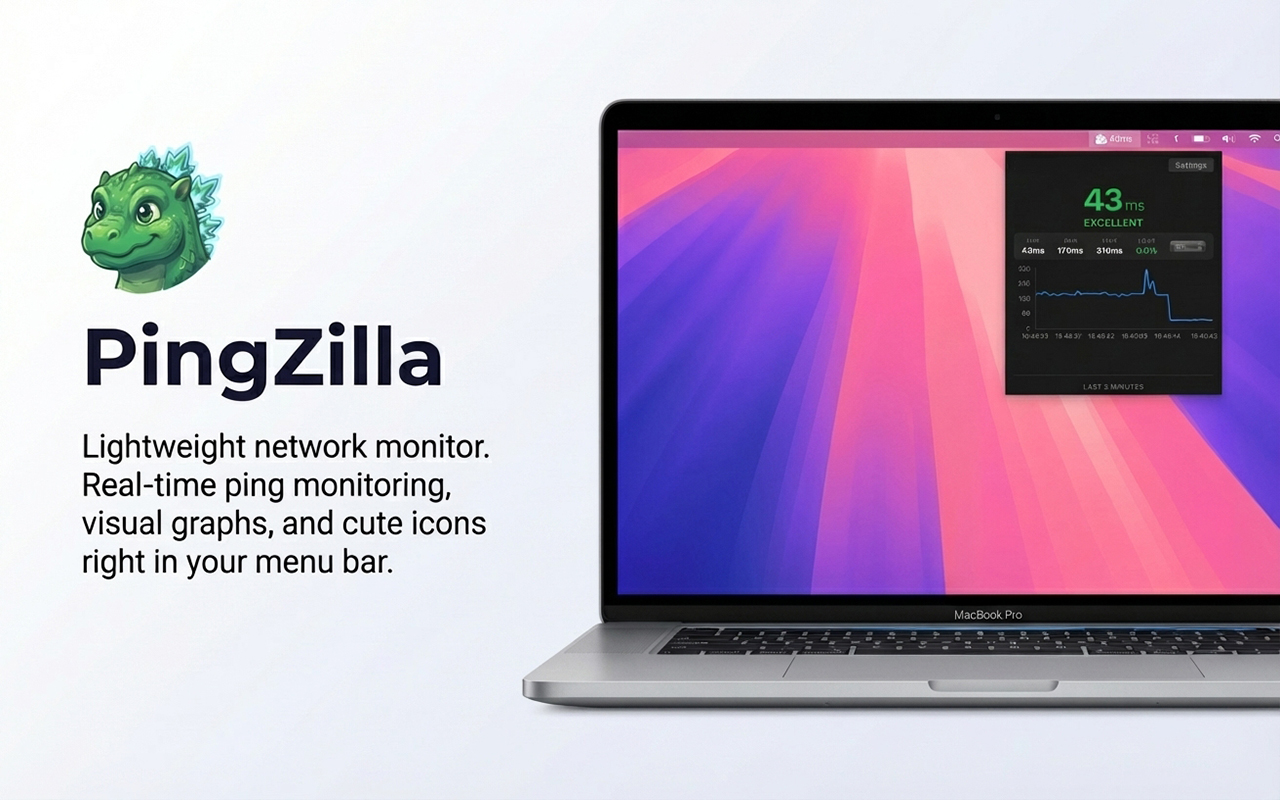
Real-time latency monitoring in your menu bar
When your latency needs a monster to keep it in check 🦖
A lightweight macOS app that watches your connection so you don't have to. VPN drop alerts, site monitoring, mood icons, and latency stats — always running, always visible.
$0.99 to support development · Open Source · macOS 13+
Your connection, at a glance
You shouldn't have to stare at a screen to know your internet is working. PingZilla watches your connection and tells you when something needs attention.
Know before it matters
Get notified the moment your connection drops or your VPN disconnects. No terminal to check, no dashboard to watch.
Stay in your call
Mid-meeting and things feel laggy? A glance at your menu bar tells you everything. No switching windows, no interrupting your flow.
Always-on, zero effort
PingZilla runs quietly in your menu bar. It monitors your connection in the background so you never have to remember to check.
Trends, not just numbers
See your latency history at a glance — min, max, average. Spot patterns before they become problems.
Watch what matters to you
Monitor multiple sites simultaneously. Your API, your e-commerce store, your client's server — all from one place.
Read the vibe, not the data
Mood icons show your connection health instantly. Green and happy? You're good. Red and angry? Time to troubleshoot.
Everything you need. Nothing you don't.
Real-time latency monitoring that lives in your menu bar — lightweight, native, and always watching.
Live Menu Bar Display
Always-visible latency readout right in your macOS menu bar. See your ping at a glance without opening any windows.
Dynamic Mood Icons
PingZilla's mood changes with your connection quality. Four expressive states let you know your network health instantly.
VPN Drop Detection
Instantly know when your VPN disconnects. PingZilla detects IP changes and alerts you before sensitive data leaks.
Site Monitoring
Monitor any host or IP address. Track uptime and latency for the services that matter to you.
Statistics Dashboard
Track min, max, average latency and connection uptime. Understand your network performance over time.
Real-Time Graph
Visual latency history in a beautiful graph. Spot trends, spikes, and connection issues at a glance.
Built for the way you work
Whether you're on a video call, in a ranked match, or debugging production — PingZilla keeps watch.
Remote Workers & Digital Nomads
Working from a cafe in Lisbon? A co-working space in Bali? PingZilla detects VPN drops instantly so your sensitive work stays protected. Know your connection quality before that important video call.
Gamers & Streamers
Every millisecond matters in competitive gaming. PingZilla shows your real-time latency right in the menu bar — no alt-tabbing required. Spot lag spikes before they cost you the match.
Developers & Power Users
Built with Tauri and Rust for native macOS performance. Minimal resource usage, no Electron bloat. Monitor your deployment targets, track connection stability, and geek out on the stats dashboard.
See it in action
Lives in your menu bar
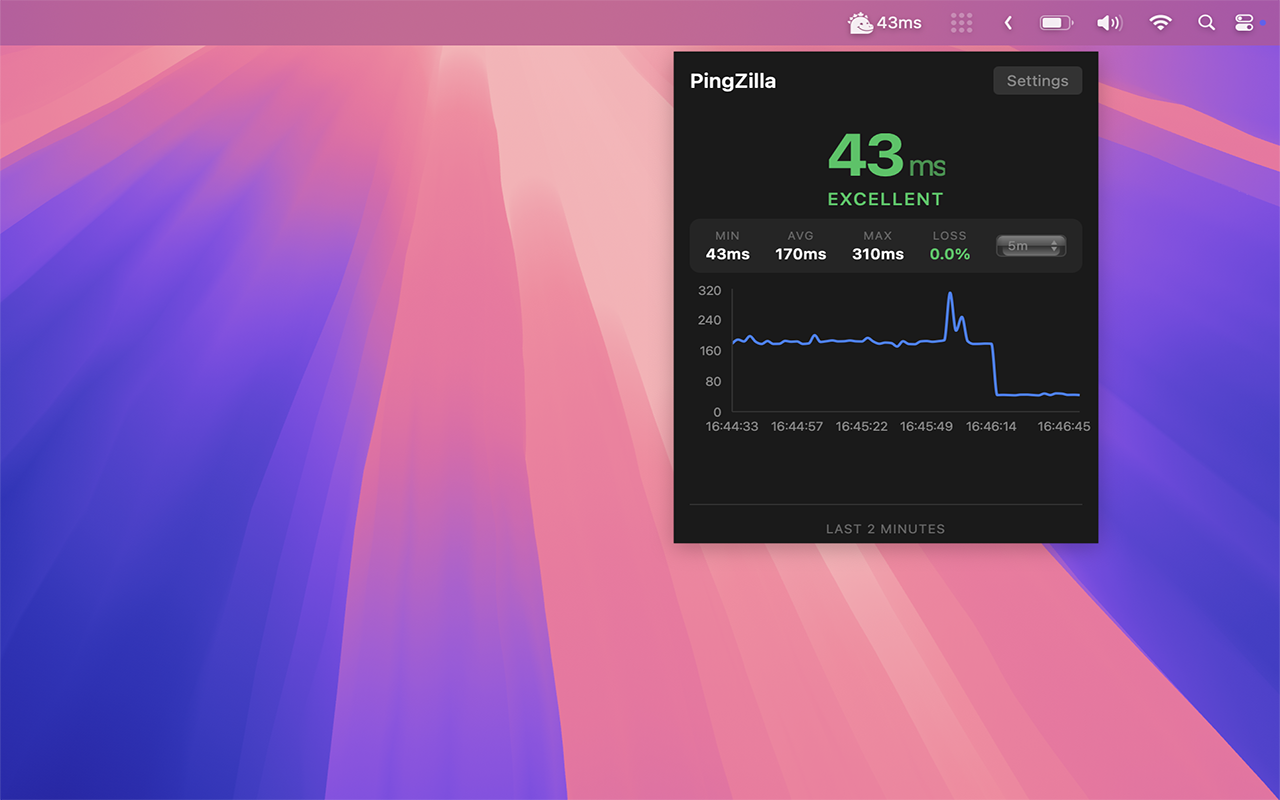
PingZilla sits quietly in your macOS menu bar, showing real-time latency with expressive mood icons. Always visible, never in the way. One click opens the full detail panel.

All the details, one click away
Click the menu bar icon to reveal the full dashboard — real-time graph, statistics, target configuration, and connection status. Everything you need without opening a separate app.
Built different
PingZilla is powered by Tauri and Rust — delivering native macOS performance without the bloat of Electron-based alternatives.
Native WebView, no bundled Chromium
Rust-powered backend, minimal overhead
~15MB memory, negligible CPU usage
Open-source codebase, always
How PingZilla stacks up
The only macOS ping monitor with VPN detection, mood icons, and a fully open-source codebase.
| Feature | PingZilla | iStat Menus | Ping Menu Bar | Network Radar |
|---|---|---|---|---|
| VPN Detection | Yes | No | No | No |
| Mood Icons | Yes | No | No | No |
| Site Monitoring | Yes | No | Yes | Yes |
| Native App | Yes | Yes | Yes | Yes |
| Open Source | Yes | No | No | No |
PingZilla ★ That's us
iStat Menus
Ping Menu Bar
Network Radar
Ready to stomp latency?
Get PingZilla on the Mac App Store and support open-source network monitoring. Native, fast, and always watching.
Open Source · macOS 13+ · $0.99 to support development